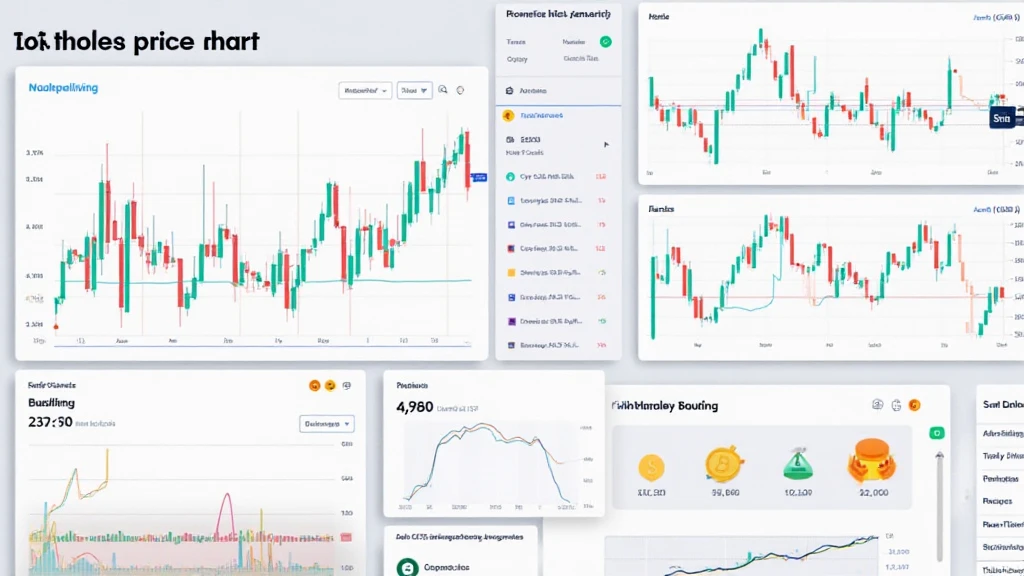
Bitcoin Price Chart Analysis Tools: A Comprehensive Guide
With Bitcoin reaching new heights and often fluctuating significantly, understanding the Bitcoin price chart analysis tools is crucial for traders. The global cryptocurrency market is booming, and in Vietnam, the number of active Bitcoin traders has surged by 35% in the last year alone. This growth underlines the need for robust tools that aid in making educated trading decisions.
In this article, we’ll delve into the world of Bitcoin price chart analysis tools, providing you with insights and practical tips to enhance your trading experience.
What are Bitcoin Price Chart Analysis Tools?
Bitcoin price chart analysis tools are designed to help traders visualize price movements of Bitcoin over various time frames. These tools can include:

- Line Charts
- Candlestick Charts
- Technical Indicators
- Chart Patterns
Understanding these elements can be likened to reading a map when navigating through an unfamiliar territory.
Types of Charts Used in Bitcoin Analysis
There are several common types of charts that traders frequently use:
1. Line Charts
Line charts connect closing prices over time, providing a clear view of price trends. They’re particularly useful for identifying long-term movements.
2. Candlestick Charts
Candlestick charts provide more information as they depict the opening, closing, high, and low prices within a specified timeframe. This type of chart is essential for traders looking for detailed price action analysis.
3. Bar Charts
Similar to candlestick charts, bar charts display price movements but in a slightly different format. They are less popular than candlestick charts but can be useful in specific trading scenarios.
4. Volume Charts
Volume charts show the number of coins traded over a given period, helping traders assess the level of interest in Bitcoin at a particular price point. High volume often indicates stronger price support or resistance.
Key Technical Indicators for Bitcoin Analysis
Technical indicators help to enhance chart analysis. Here are some of the most widely used indicators:
1. Moving Averages
Simple Moving Average (SMA) and Exponential Moving Average (EMA) are vital for identifying trend directions. For instance, many traders use the golden cross strategy which involves identifying when the 50-day moving average crosses above the 200-day moving average.
2. Relative Strength Index (RSI)
The RSI measures the speed and change of price movements on a scale of 0 to 100. An RSI above 70 can indicate overbought conditions, while an RSI below 30 may show oversold conditions.
3. Bollinger Bands
Bollinger Bands consist of a middle band (SMA) and two outer bands. These bands expand and contract based on market volatility, giving traders insights into potential price movements.
Utilizing Chart Patterns in Bitcoin Analysis
Chart patterns can help predict future price movements based on historical data.
- Head and Shoulders: This pattern indicates a reversal trend.
- Double Top and Double Bottom: These are crucial for identifying potential price reversals.
- Triangles: Ascending and descending triangles can indicate continuation or reversal.
Case Study: Bitcoin Price Movement in 2023
According to CoinMarketCap, Bitcoin’s price fluctuated immensely in Q1 2023, hitting $45,000 and dropping to approximately $30,000 by the end of March. Utilizing the tools mentioned above, traders could observe:
- A bullish trend leading up to the $45,000 peak
- Bearish signals as the price approached $42,000
- Potential buy signals when the price rebounded at $30,000
Combining Analysis Tools for Enhanced Strategy
Effective trading strategy combines multiple tools:
- Use candlestick patterns to identify market sentiment.
- Apply RSI to assess whether Bitcoin is overbought or oversold.
- Incorporate moving averages to confirm price trends.
Here’s the catch: while tools are vital, combining them effectively is where the magic happens.
Insights for Traders in Vietnam
Vietnam’s crypto market is thriving. According to Statista, the country saw a 20% increase in cryptocurrency use among the population from 2022 to 2023. This presents an exciting opportunity for traders to engage with Bitcoin price analysis using the right tools.
The integration of tiêu chuẩn an ninh blockchain in local transactions can also bolster trust and credibility when trading Bitcoin, allowing traders to feel secure in their investment decisions.
Conclusion
In summary, understanding and utilizing Bitcoin price chart analysis tools can significantly enhance your trading strategy. By familiarizing yourself with different chart types, indicators, and patterns, you can gain valuable insights into price movements. Remember, tools are not a guarantee of success, but they are essential in helping to make informed decisions.
As you continue your trading journey, keep emulating the trends and don’t overlook the opportunity to adapt to the constantly shifting cryptocurrency landscape. Dive into the vast resources available on platforms like cryptopaynetcoin to empower your trading strategy further.
About the Author: John Doe is a blockchain technology expert with over 10 published papers in the field and has led audits for several major crypto projects. His insights into cryptocurrency trading have been influential in shaping trading strategies.


